If you’ve been investing for even five minutes, you’ve probably heard someone say: “Should I buy XEQT or VEQT?”
These two ETFs have become the default answer for Canadian investors who want a simple, set-it-and-forget-it way to invest.
But here’s the thing:
Everyone’s obsessing over them… and I’m not.
Let’s break this down honestly, without hype.
What Exactly Is an “All-In-One ETF”?
Before comparing XEQT and VEQT, it helps to understand what these products actually are.
An all-in-one ETF is basically a complete investment portfolio inside a single fund.
It gives you:
- Global diversification
Automatic rebalancing
A mix of stocks from around the world
A simple, hands-off experience
Instead of buying 4–5 ETFs on your own and rebalancing them every year, an all-in-one ETF does it automatically.
Think of it like buying the entire world stock market in one click.
That’s why these products exploded in popularity.
A Quick History of XEQT and VEQT
Even though it feels like they’ve been around forever, both ETFs are pretty new:
VEQT launched in January 2019
XEQT launched in August 2019
These releases kicked off the “turnkey portfolio” era — easy portfolios for people who don’t want to build everything from scratch.
The Most Fair Comparison
VEQT had a 7-month head start.
So comparing “since inception” gives it an unfair advantage.
To keep it fair, we compare from August 7, 2019 — XEQT’s official launch date.
Total Returns (Aug 2019 → Today)
XEQT: +123.16%
VEQT: +118.09%
Annualized Returns
XEQT: ~13.60% per year
VEQT: ~13.18% per year
Both are excellent returns — but the sample is extremely short (6 years) and includes one of the most chaotic cycles in history:
2020 crash
2020–2021 massive rebound
Tech bubble 2.0
Inflation shock
Rate hikes
2023–2024 bull run
Amazing results… but definitely not “normal.”
Expect the next 10–20 years to look calmer and more average.
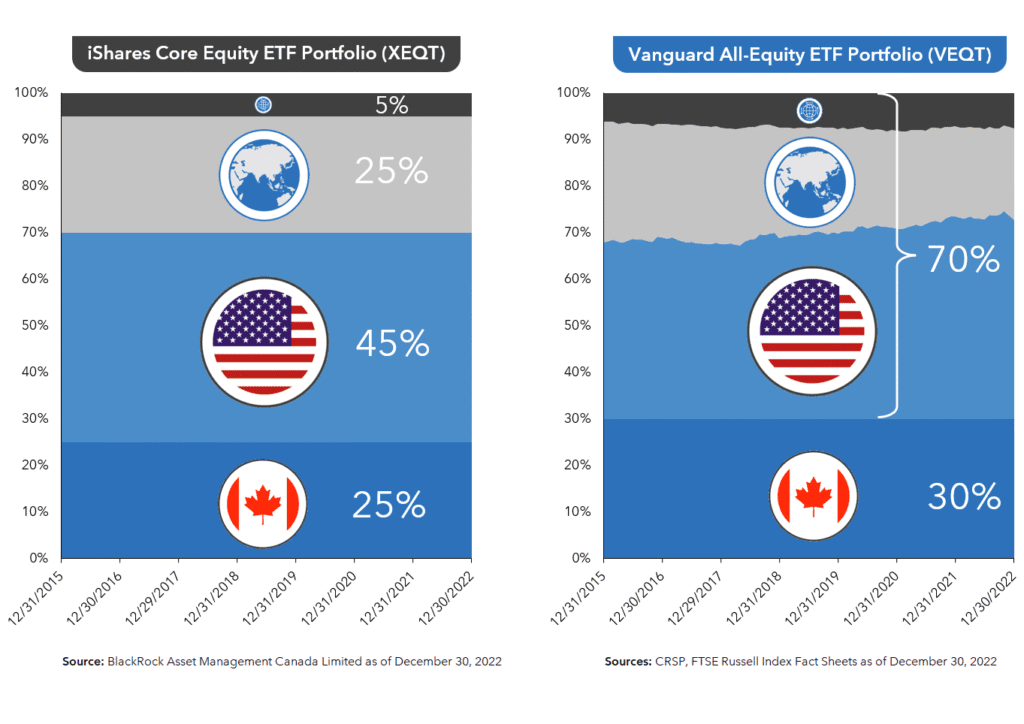
What’s Actually Inside XEQT and VEQT?
This is where the ETFs differ — just slightly.
Both funds own thousands of stocks through underlying ETFs.
Here’s a simplified breakdown:
XEQT (iShares)
Slightly more US stocks.
Typical weights (approximate):
US stocks: ~46%
International developed markets: ~26%
Emerging markets: ~6%
Canada: ~22%
Top underlying holdings include:
Apple
Microsoft
Amazon
Nvidia
Alphabet
…through the iShares core ETFs (XUU, XEF, XEC, XIC)
VEQT (Vanguard)
Slightly more Canadian stocks.
Typical weights (approximate):
US stocks: ~43%
International developed markets: ~29%
Emerging markets: ~6%
Canada: ~22–25%
Top underlying holdings include:
Apple
Microsoft
Royal Bank of Canada
Shopify
TD Bank
…through Vanguard’s core ETFs (VUN, VIU, VEE, VCN)
Why the Returns Are So Similar
Both portfolios are built using the same ingredients — global equities, with very similar weights.
The only real differences are:
XEQT → slightly more US
VEQT → slightly more Canada
And yes — Canada is only ~3% of the world market, so the impact is small.
Management Fees: Also Nearly Identical
XEQT: 0.20%
VEQT: 0.17%
On a $100,000 portfolio:
XEQT → $200 per year
VEQT → $170 per year
A difference of $30.
Not exactly retirement-destroying.
So… Which One Should You Choose?
Here’s the truth:
Both do their job extremely well.
They’re simple, diversified, reliable, and built for long-term growth.
The real question isn’t: 👉 “XEQT or VEQT?”
It’s: “Are you willing to stick with any ETF through market ups and downs for the next 20 years?”
Consistency matters more than the logo on the ETF.
If you prefer:
US-heavy exposure → XEQT
More Canada in the mix → VEQT
Pick one and move on with your life.
Your wealth won’t be decided by 0.03% in fees or a 2–3% difference in country weighting.
It will be decided by your discipline and time in the market.
Ready to take control of your finances—for real this time?
Want a step-by-step system to set this up?
Download your FREE copy of Your Financial Empowerment Starter Kit.
It will walk you through the habits and tools to start moving your money with purpose.